

Split of the well-known push networks

- May 28, 2019
- by VG
- Reviews: 0
Few days ago I decided to split well-known push networks to determine which one of them is the most profitable to the webmaster on the market at the moment.
All data will be supported by screenshots, and in the end we summarize: which network will bring you maximum profit, comparing to other ones.
Go! :)
Participants
- cerber.top
- clicktimes
- datspush
- daopush
- evadav
- loadpush
- luxepush
- offergate
- publisher.house
- pushads
- realpush
- redpush
- zpush
So, I selected tier1 countries, and bought traffic on clickadu network to the most similar video landing. In those networks, where I can set number of push sent to user - I choose maximum settings - 16 cents per user daily.
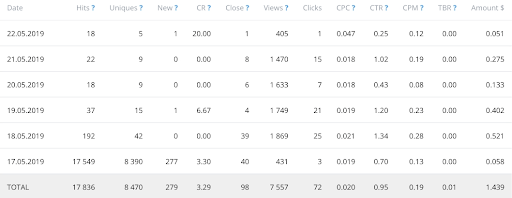
Screenshots from clickadu
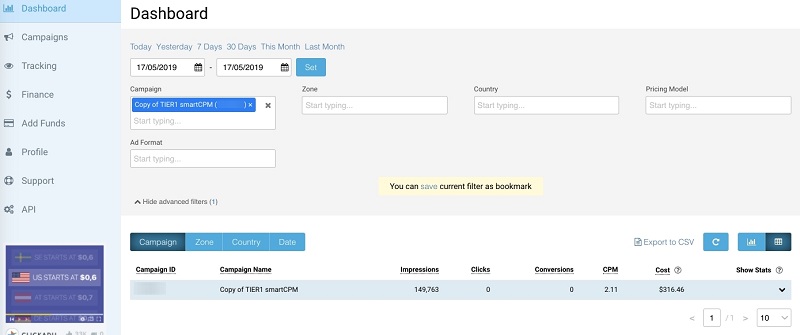
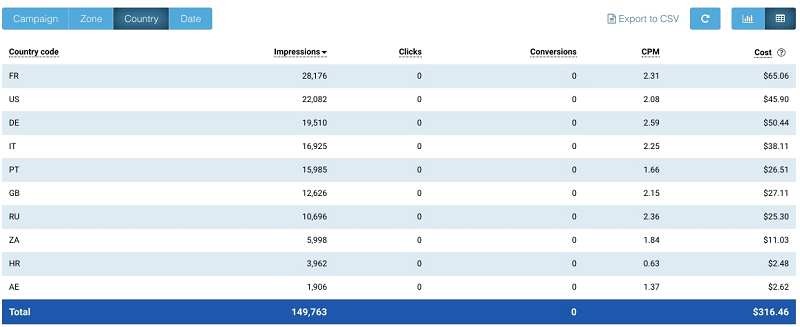
I have sent about 10k users to each network.
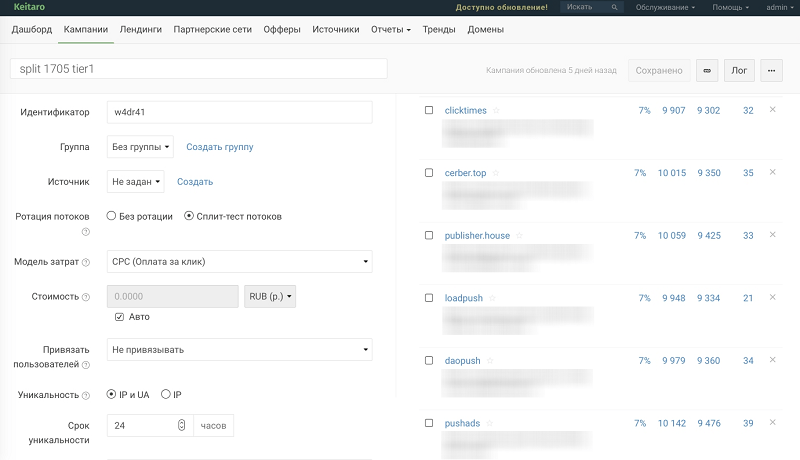
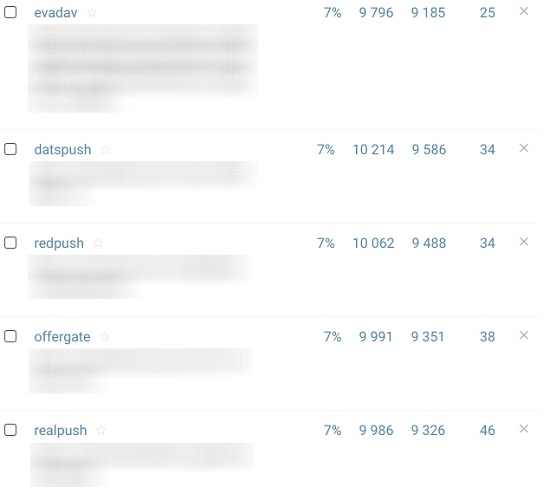
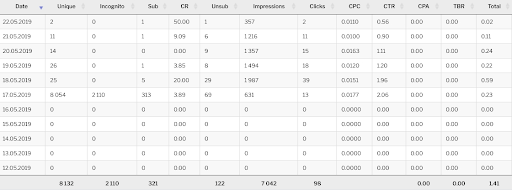
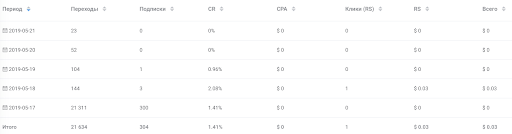
Screenshots of KeitaroTDS

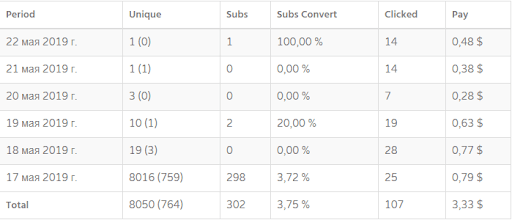
After that, I selected numbers from the statistics of each push network and get following results (from best to worst one):
1) Daopush - $ 3.33 profit
2) Zpush - $ 3.05 profit
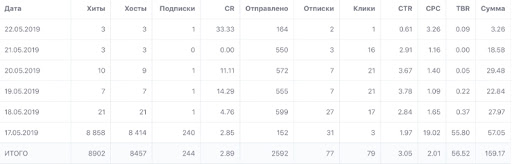
3) Redpush - 159.17 rubles or $ 2.44
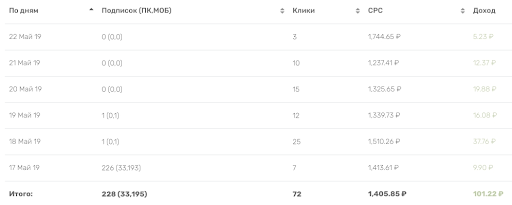
4) Profit Loadpush - 101.22 rub. or $ 1.58 profit
5) Clicktimes - $ 1.44 profit
6) Evadav - $ 1.41 profit
7) Realpush - $ 1.39 profit
8) Datspush - $ 1.02 profit
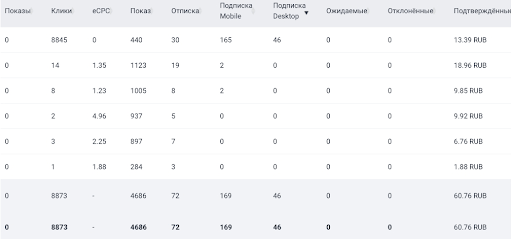
9) Offergate - 60.76 rub. or $ 0.92 Profit
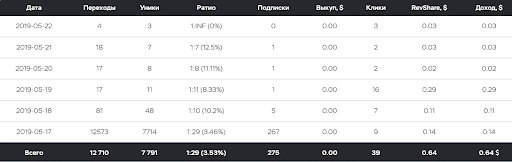
10) Publisher.house - $ 0.64
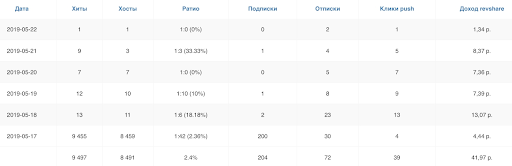
11) Profit Pushads - 41.97 rub. or $ 0.63 profit
12) Cerber.top - $ 0.05
13) Profit Luxepush - $ 0.03 profit
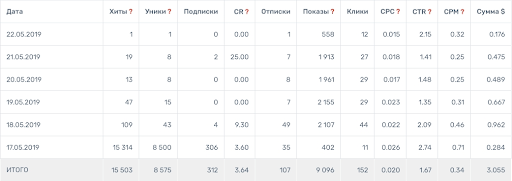
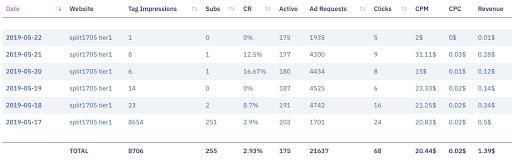
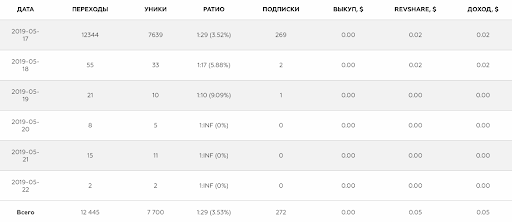
Then I collected the conversion data into a small table:
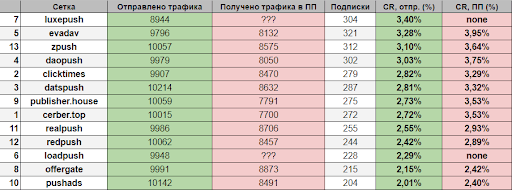
Description of the table columns:
Traffic sent - traffic that was sent to the landing URL;
Received traffic in the PP - the number of uniques to the landing, counted by network;
Subscriptions - number of conversions;
CR, Sent (%) - conversion rate, calculated according to the formula [subscriptions / sent_traffic * 100];
CR, PP (%) - the same as CR, send. (%), only the calculation for the column "Received traffic in PP";
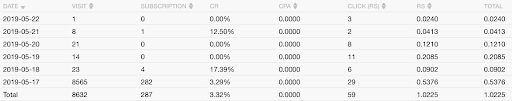
And also I want to show you final results of traffic payback during 5 days - in the form of a table:
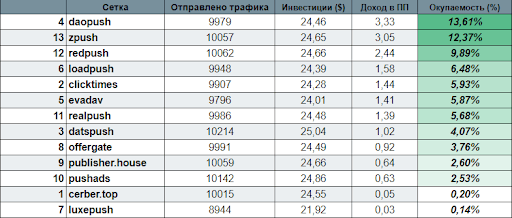
Description of columns:
Traffic sent - number of clicks sent to the landing URL;
Investments ($) - traffic costs, calculated according to the formula [total_costs _ ($ 316.46) / all_transitions_ in_KeitaroTDS_ (129100) * sent_ traffic];
Revenue in PP - earned in push network;
Payback (%) - the percentage of the return on the invested amount, calculated by the formula [income_in_pp * 100 / investment _ ($)];
This table will be updated regularly. And wait for a similar test for CIS traffic soon, but something tells me that best results will not have significant differences ;)
Subscribe to my page in FB and stay tuned! :)
Thank you all, write your questions in the comments :)
Recent Posts
July 14, 2026
adset.pro Review: Tracker, PWA and Gaming Landers in One Stack for iGaming Buyers
In iGaming media buying, the biggest leak is often not the creative, not the offer, and not even the...
Read moreJuly 13, 2026
AMarkets Review: Daily Payouts, Strong Brand Awareness, and CPA up to $2,000
When driving traffic to Forex and trading offers, a broker's reputation is everything. The trading a...
Read moreJuly 07, 2026
The double-digit sale calendar: How to profit every month from 7.7 to 12.12
Galaksion is an advertising network providing high-converting traffic solutions. This guide focuses...
Read more
Written by
VG