Google Quality Score–Should You Optimize for This Metric?

- September 19, 2018
- by Uliana_Moreva
- Reviews: 0
Quality Score Has been a part of Google Ads since 2005 and over the last few years, Google has released more information about what elements of your account is used to calculate your score from 1-10, with 10 being the best score. While it is important to know what your Quality Score is, it is more crucial to know if optimizing your account to improve quality score will benefit your overall results.
Quality Score Elements
There are three components Google reviews to determine your score:
- Expected Clickthrough Rate
- Ad Relevance
- Landing Page Experience
By using these elements Google can express how they think my ads will perform (Expected CTR), if the ad copy is congruent with the searcher’s query (Ad Relevance), and if the final destination is helpful in answering the searcher’s quest (Landing Page Experience.) For today’s understanding, expected CTR and ad relevance are often improved by testing ad copy or pausing underperforming keywords. For Landing Page Experience, you can either test segments of your landing page to improve the user’s journey, or again test ad copy to make sure that the ad aligns with your landing page’s message.
Sifting Through Historical Data
Pulling Historical Quality Score reports can lead to some great insights about how Google interprets your ad performance, but it will also help you learn how to talk about why Quality Score isn’t a metric to optimize towards but a metric to see what you should test next.
One of my clients specializes in a type of counseling for young women, and the keywords we bid on are competitive but also are not specific to what only my client can provide. The best way our ads work is to pre-qualify the user before they click. A user may have searched for “counseling” but when our ad pops up and it says “Are You a Young Woman? – Talk to our Counselors Today”, this ad may not get a lot of clicks because it will sort out men, women who don’t need this type of counseling, or friends and family members who are trying to find options for a loved one.
Because our ad copy does a great job of pre-qualifying users, the leads that come through are mostly for our target audience (along with demographic bid modifiers for age and gender). If you look at our quality score for our Expected CTR it is a bit deceiving because it might look like we are missing the mark.
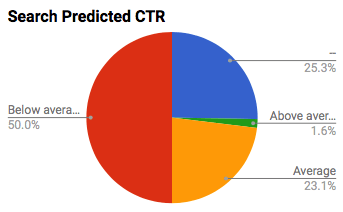
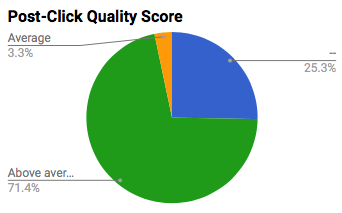
Once I look towards the Landing Page Experience, my client and I know that we are making the right calls because our Quality Score of this category is 71% above average with 3% being average. We might not have Google’s highest rating for our CTR scores, but we rather not spend the money on a click if our ad copy can tell the user that this service isn’t for you, please find another option from the ads either above or below our ad.
Provide Testing Ideas
The example above showed why the client and I don’t focus on every element of Quality Score, but we still pull reports every quarter as a health check. This client, in particular, wants to focus on people in California since the majority of their services are within this state. With this new focus, we developed new campaigns just for this state, but our ad rank was struggling compared to our Nationwide campaigns. In the example below, you will notice that in July our average Quality Score jumped to 4.75, and the reason behind this jump was testing new ad copy.
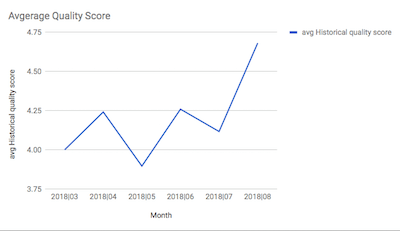
After this ad copy test, we also noticed that our impression share due to ad rank dropped as well. By pulling these type of reports, we can see why our ad rank might be lower and we can test new copy. Our Quality Score may have increased due to this test, but the purpose of the test was not to improve this metric as much as to see if we can engage more users within a geographical target.
Keyword Level Quality Score
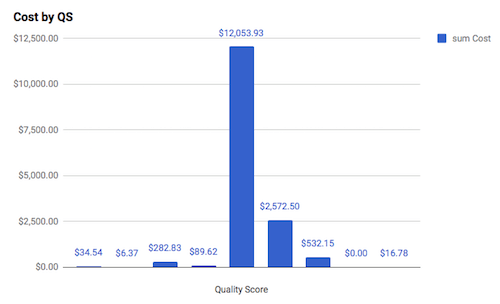
While I take the ad recommendations for Quality Score with a grain of salt, the keyword level does tell you if Google can run your ad based on your keyword’s score. By going into Google and pulling a report you will be able to see the disbursement of your keywords. Below is a snapshot for the client mentioned above, but you can see that a majority of the enabled keywords are a 5 or above.
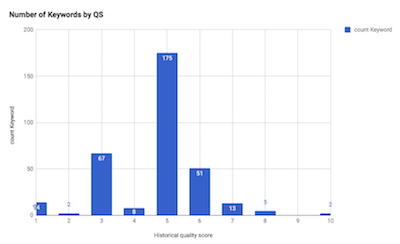
This report with a list of the keywords below a 5 helps the client and myself evaluate if these keywords should be segmented into their own ad group with specialized ad copy to help boost its ranking, crank up bids to try and buy some ad rank, or if the keywords are even needed in our account. If you are considering pausing keywords, you can create a spend disbursement table to show if you would be able to move that spend to the higher performing keywords.
Final Thoughts
Pulling Quality Score reports can benefit you and your account by giving you a guiding light on where you can optimize. While pulling these reports, understand that your specific strategy may not fall exactly in line with Google’s recommendations and your score may not be 10s across the board. By knowing the client’s business and what KPIs matter the most to your client, you will be able to sift out what part of the Quality Score and their recommendations you can use to test, or what suggestions you can leave behind.
By Diane Chelius | @DianeChelius | Account Manager at Hanapin Marketing
Recent Posts
December 16, 2025
Stop Waiting, Start Scaling: Why Sms-online.pro is the Secret Weapon for High-Volume Affiliates
Learn about SMS-online.pro and their offerings for affiliate marketers.
Read moreNovember 21, 2025
The 2025 Arbitrage Toolkit: Using Proxies to Scale Campaigns Safely
In 2025, anti-fraud measures and tighter GEO regulations make it difficult for traffic arbitrage. Fi...
Read moreNovember 14, 2025
BigTraff Review: 500+ Gambling Offers & Your Competitive Advantage with Custom Chatbots
Learn about BigTraff: the larges iGaming affiliate program with custom chatbot solutions.
Read more


Written by
Uliana_Moreva
Hey, my name is Uliana, I am here to provide you with the top affiliate content, starting from Facebook arbitrage to Push traffic. Ask me anything: uliana@affbank.com